NEWTON'S SECOND LAW EXPERIMENT
In the Ampere's Law simulation the student measures the H-field in a conductor in relative units and the B-field exterior to the conductor in relative units. A switch is provided to enable the student to reverse the current so that they can see the effect this has on the B-field. A plot of the B-field vs the H-field produces a linear function which the student is instructed to graph. The slope of the function is then determined. The slope is a magnetic constant related to the wire conductor used.
The student is asked to use the Wire Table to find the value of the magnetic constant associated with the wire number used. A percent error for the experiment is also required. Two or three different wires should be used. This will give the student the opportunity to use their Mathematical skills.
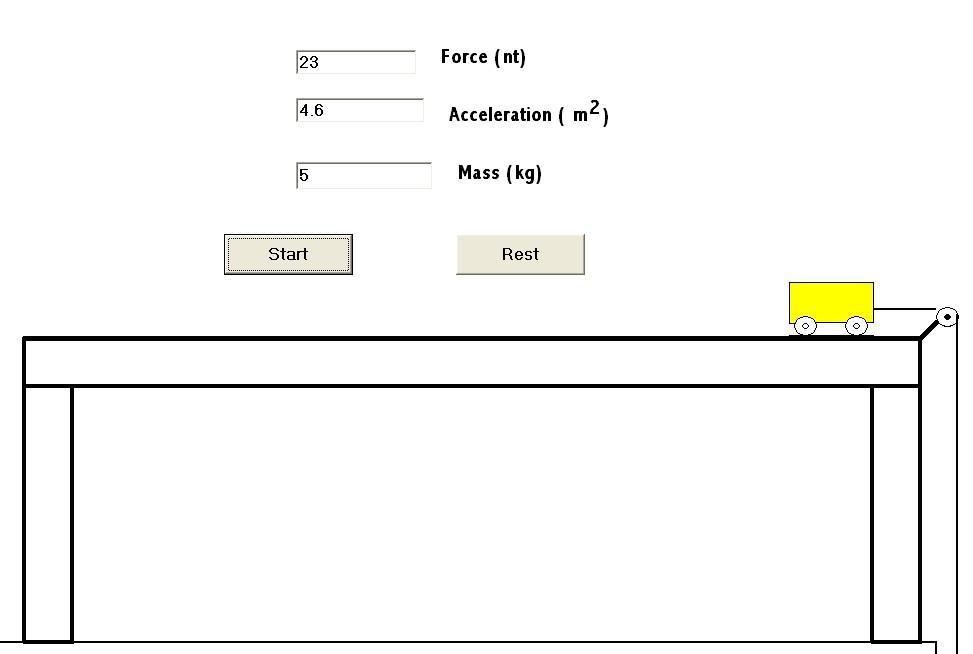
In Experiment A the student will use a lab cart. He will keep the force on the cart constant and measure the acceleration as the mass of the cart changes. A graph of Acceleration vs Mass indicates that there is an inverse relationship between Acceleration and Mass.
A graph of Log Acceleration vs Log Mass produces and equation of a straight line.
Log A = m Log M + b where m = slope of the line
The slope = - 1 indicating that Acceleration is inversely proportional to the Mass.
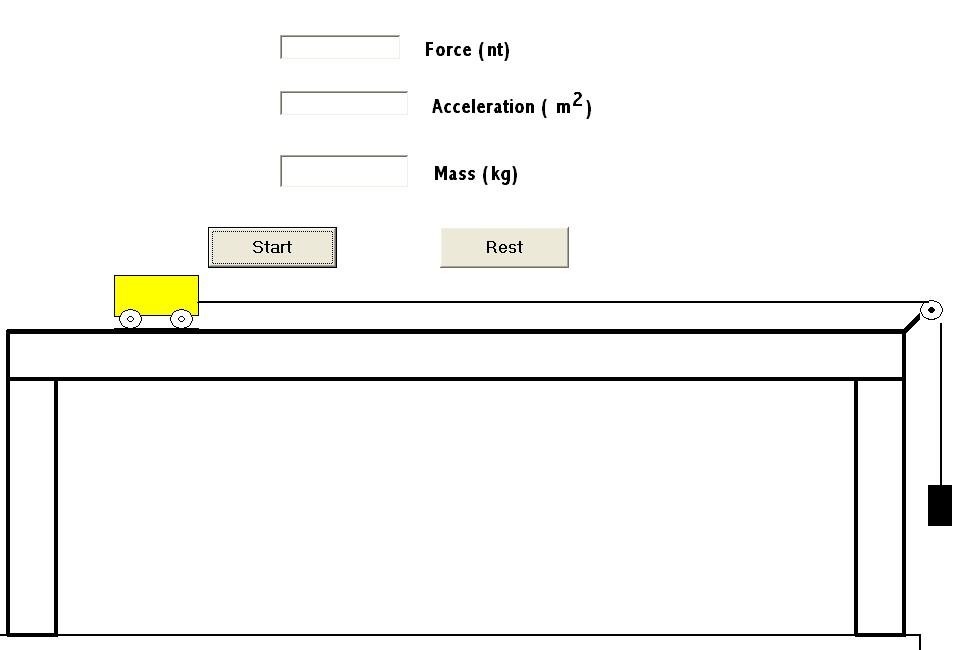
Experiment B uses the lab cart again. The Mass of the lab cart is kept constant. The Force is then varied and the Acceleration measured for each change in Force.
The student plots a graph of Acceleration vs Force. This produces a straight line. The conclusion is that Acceleration is directly proportional to Force.
Putting the two facts obtained in both experiments together, the student then learns Newton's Second Law of Motion.
Graph paper, log log graph paper, and data tables are provided on line without cost.
An online reference to Newton' Laws is also given.